Note
Click here to download the full example code
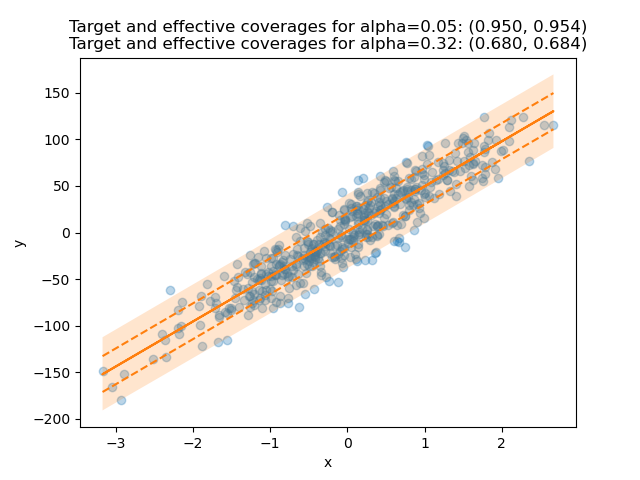
Plotting MAPIE prediction intervals with a toy dataset
An example plot of MapieRegressor used
in the Quickstart.
Out:
/home/docs/checkouts/readthedocs.org/user_builds/mapie/conda/latest/lib/python3.10/site-packages/mapie/utils.py:598: UserWarning: WARNING: The predictions are ill-sorted.
  warnings.warn(
/home/docs/checkouts/readthedocs.org/user_builds/mapie/conda/latest/lib/python3.10/site-packages/mapie/utils.py:598: UserWarning: WARNING: The predictions are ill-sorted.
  warnings.warn(
import numpy as np
from matplotlib import pyplot as plt
from sklearn.datasets import make_regression
from sklearn.linear_model import LinearRegression

from mapie.metrics import regression_coverage_score
from mapie.regression import MapieRegressor

regressor = LinearRegression()
X, y = make_regression(n_samples=500, n_features=1, noise=20, random_state=59)

alpha = [0.05, 0.32]
mapie = MapieRegressor(regressor, method="plus")
mapie.fit(X, y)
y_pred, y_pis = mapie.predict(X, alpha=alpha)

coverage_scores = [
    regression_coverage_score(y, y_pis[:, 0, i], y_pis[:, 1, i])
    for i, _ in enumerate(alpha)
]

plt.xlabel("x")
plt.ylabel("y")
plt.scatter(X, y, alpha=0.3)
plt.plot(X, y_pred, color="C1")
order = np.argsort(X[:, 0])
plt.plot(X[order], y_pis[order][:, 0, 1], color="C1", ls="--")
plt.plot(X[order], y_pis[order][:, 1, 1], color="C1", ls="--")
plt.fill_between(
    X[order].ravel(),
    y_pis[order][:, 0, 0].ravel(),
    y_pis[order][:, 1, 0].ravel(),
    alpha=0.2,
)
plt.title(
    f"Target and effective coverages for "
    f"alpha={alpha[0]:.2f}: ({1-alpha[0]:.3f}, {coverage_scores[0]:.3f})\n"
    f"Target and effective coverages for "
    f"alpha={alpha[1]:.2f}: ({1-alpha[1]:.3f}, {coverage_scores[1]:.3f})"
)
plt.show()
Total running time of the script: ( 0 minutes 0.333 seconds)