Note
Click here to download the full example code
Reproducing the simulations from Kim et al. (2020)
MapieRegressor is used to reproduce the simulations
by Kim et al. (2020) [1] in their article which introduces the
jackknife+-after-bootstrap method.
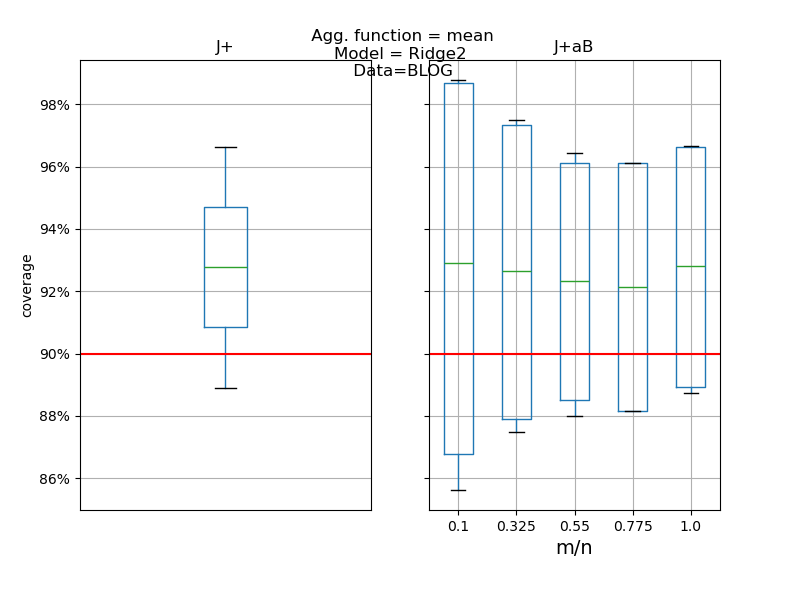
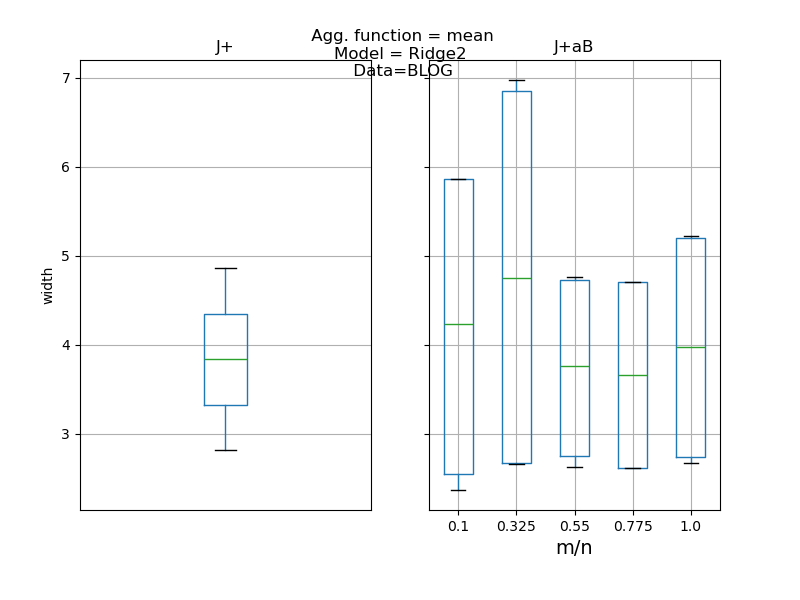
For a given model, the simulation fits MAPIE regressors with jackknife+ and jackknife+-after-bootstrap methods, on different resamplings of a data set loaded from ‘https://archive.ics.uci.edu/’, and compares the coverage levels and the width means of the PIs.
In order to reproduce results from the tutorial notebook of [1], we
implemented their regression model Ridge2, a variant of sklearn.Ridge
with an adaptive regularization parameter (other models can also be tested).
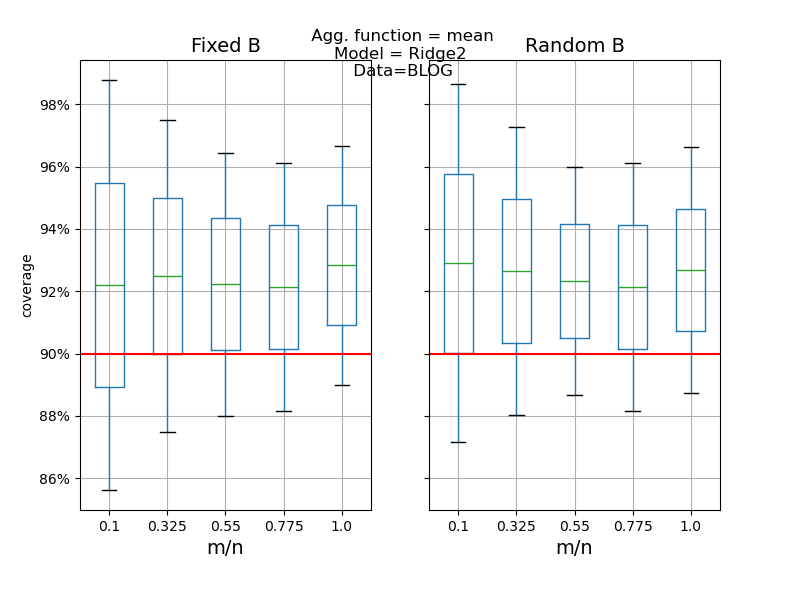
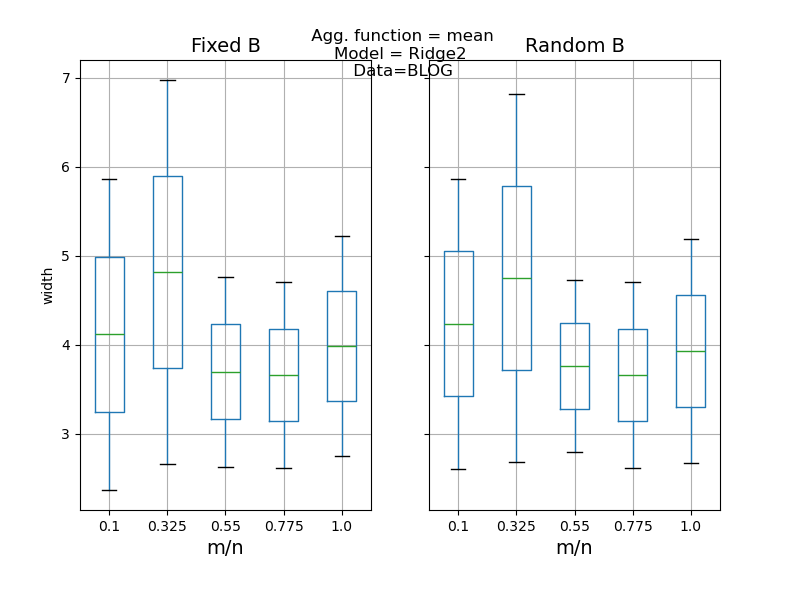
We compare jackknife+ and jackknife+-after-bootstrap, with fixed and random
numbers of bootstraps, for a given training set of size n, and different
resampling sets of size m, following the discussion in [1].
This simulation is carried out to assert that the jackknife+ and jackknife+-after-bootsrap methods implemented in MAPIE give the same results than [1], and that the targeted coverage level is obtained.
[1] Byol Kim, Chen Xu, and Rina Foygel Barber. “Predictive Inference Is Free with the Jackknife+-after-Bootstrap.” 34th Conference on Neural Information Processing Systems (NeurIPS 2020).
Out:
<class 'pandas.core.frame.DataFrame'>
Int64Index: 22 entries, 0 to 21
Data columns (total 8 columns):
 #   Column        Non-Null Count  Dtype
---  ------        --------------  -----
 0   itrial        22 non-null     int64
 1   estimator     22 non-null     object
 2   method        22 non-null     object
 3   coverage      22 non-null     float64
 4   width         22 non-null     float64
 5   m             22 non-null     int64
 6   agg_function  22 non-null     object
 7   alpha         22 non-null     float64
dtypes: float64(3), int64(2), object(3)
memory usage: 1.5+ KB
None
from __future__ import annotations

import ssl
from io import BytesIO
from typing import Any, Optional, Tuple
from urllib.request import urlopen
from zipfile import ZipFile

import matplotlib.pyplot as plt
import matplotlib.ticker as mtick
import numpy as np
import pandas as pd
from sklearn.base import BaseEstimator, RegressorMixin
from sklearn.linear_model import Ridge
from sklearn.model_selection import train_test_split

from mapie._typing import ArrayLike, NDArray
from mapie.metrics import (regression_coverage_score,
                           regression_mean_width_score)
from mapie.regression import MapieRegressor
from mapie.subsample import Subsample


def get_X_y() -> Tuple[NDArray, NDArray]:
    """
    Downloads the ``blog`` dataset from a zip file on the UCI Machine Learning
    website, and returns X and y, which are respectively the explicative
    data and the labels.

    Returns
    -------
    Tuple[NDArray, NDArray] of shapes
    (n_samples, n_features) and (n_samples,)
        Explicative data and labels
    """
    website = "https://archive.ics.uci.edu/"
    page = "ml/machine-learning-databases/"
    folder = "00304/"
    zip_folder = "BlogFeedback.zip"
    csv_file = "blogData_train.csv"
    url = website + page + folder + zip_folder
    ssl._create_default_https_context = ssl._create_unverified_context
    resp = urlopen(url)
    zipfile = ZipFile(BytesIO(resp.read()))
    df = pd.read_csv(zipfile.open(csv_file)).to_numpy()
    X = df[:, :-1]
    y = np.log(1 + df[:, -1])
    return (X, y)


class Ridge2(RegressorMixin, BaseEstimator):
    """
    Little variation of Ridge proposed in [1].
    Rectify alpha on the training set svd max value.

    Parameters
    ----------
    ridge_mult : float
        Multiplicative factor such that the alpha factor of the ``Ridge`` model
        fitted by ``Ridge2`` is the squared maximum eigenvalue of the training
        set times ``ridge_mult``.
    """

    def __init__(self, ridge_mult: float = 0.001) -> None:
        self.ridge_mult = ridge_mult
        self.__name__ = "Ridge2"

    def fit(self, X: NDArray, y: Optional[NDArray] = None) -> Ridge2:
        """
        Fit Ridge2.

        Parameters
        ----------
        X : NDArray of shape (n_samples, n_features)
            Training data.

        y : NDArray of shape (n_samples,)
            Training labels.

        Returns
        -------
        Ridge2
            The model itself.
        """
        alpha = self.ridge_mult * np.linalg.svd(X, compute_uv=False).max() ** 2
        self.ridge2 = Ridge(alpha=alpha).fit(X=X, y=y)
        return self

    def predict(self, X: ArrayLike) -> NDArray:
        """
        Predict target on new samples.

        Parameters
        ----------
        X : ArrayLike of shape (n_samples, n_features)
            Test data.

        Returns
        -------
        NDArray of shape (n_samples, )
            Predictions on test data
        """
        return self.ridge2.predict(X)


def compute_PIs(
    estimator: BaseEstimator,
    X_train: NDArray,
    y_train: NDArray,
    X_test: NDArray,
    method: str,
    cv: Any,
    alpha: float,
    agg_function: Optional[str] = None,
) -> pd.DataFrame:
    """
    Train and test a model with a MAPIE method,
    and return a DataFrame of upper and lower bounds of the predictions
    on the test set.

    Parameters
    ----------
    estimator : BaseEstimator
        Base model to fit.
    X_train : NDArray
        Features of training set.
    y_train : NDArray
        Target of training set.
    X_test : NDArray
        Features of testing set.
    method : str
        Method for estimating prediction intervals.
    cv : Any
        Strategy for computing conformity scores.
    alpha : float
        1 - (target coverage level).
    agg_function: str
        'mean' or 'median'.
        Function to aggregate the predictions of the B estimators.

    Returns
    -------
    pd.DataFrame
        DataFrame of upper and lower predictions.
    """
    mapie_estimator = MapieRegressor(
        estimator=estimator,
        method=method,
        cv=cv,
        n_jobs=-1,
        agg_function=agg_function,
    )

    mapie_estimator = mapie_estimator.fit(X=X_train, y=y_train)
    _, y_pis = mapie_estimator.predict(X=X_test, alpha=alpha)
    PI = np.c_[y_pis[:, 0, 0], y_pis[:, 1, 0]]
    return pd.DataFrame(PI, columns=["lower", "upper"])


def get_coverage_width(PIs: pd.DataFrame, y: NDArray) -> Tuple[float, float]:
    """
    Computes the mean coverage and width of the predictions intervals of a
    DataFrame given by the ``compute_PIs`` function

    Parameters
    ----------
    PIs : pd.DataFrame
        DataFrame returned by `compute_PIs``, with lower and upper bounds of
        the PIs.

    y : NDArray
        Targets supposedly covered by the PIs.

    Returns
    -------
    (coverage, width) : Tuple[float, float]
        The mean coverage and width of the PIs.
    """
    coverage = regression_coverage_score(
        y_true=y, y_pred_low=PIs["lower"], y_pred_up=PIs["upper"]
    )
    width = regression_mean_width_score(
        y_pred_low=PIs["lower"], y_pred_up=PIs["upper"]
    )
    return (coverage, width)


def B_random_from_B_fixed(
    B: int,
    train_size: int,
    m: int,
    itrial: int = 0,
    random_state: int = 98765
) -> int:
    """
    Generates a random number from a binomial distribution.

    Parameters
    ----------
    B : int
        Fixed B, parameter of the binomial distribution
    train_size : int
        Training set size
    m : int
        Resampling set size
    itrial : int
        Number of the trial
    random_state
        Base random state (fixed according to [1].)

    Returns
    -------
    int
        Integer drawn according to
        Binomial(B/(1-1/(train_size+1))^m),(1-1/(train_size+1))^m),
        where B, train_size and m are parameters.
    """
    np.random.seed(random_state + itrial)
    return int(
        np.random.binomial(
            int(B / (1 - 1.0 / (1 + train_size)) ** m),
            (1 - 1.0 / (1 + train_size)) ** m,
            size=1,
        )
    )


def comparison_JAB(
    model: BaseEstimator = Ridge2(),
    agg_function: str = "mean",
    alpha: float = 0.1,
    trials: int = 10,
    train_size: int = 200,
    boostrap_size: int = 10,
    B_fixed: int = 50,
    random_state: int = 98765,
) -> pd.DataFrame:
    """
    Launch trials of jackknife-plus and jackknife-plus_after_boostrap,
    with B fixed and random, for a given number of resample size and a given
    number of trials, and returns the results as a DataFrame,

    Parameters
    ----------
    model : BaseEstimator
        Base model. By default, Ridge2.
    agg_function: str
        Aggregation function to test.
    alpha : float
        1 - (target coverage level).
    trials: int
        Number of trials launch for a given boostrap set size.
    train_size : int
        Size of the train set.
    bootstrap_size : int
        Number of boostrap sizes to test,
        uniformly distributed between 10 and 100%
        of the train set size.
    B_fixed : int
        Number of bootstrap samples in J+aB is drawn as
        B ~ Binomial(int(B_fixed/(1-1/(n+1))^m),(1-1/(n+1))^m),
        where n is the training set size, and m the resampling set size.
    random_state : int
        Random state. By default, 98765 (from [1]).

    Returns
    -------
    pd.DataFrame
        DataFrame with columns:
        - itrial : the number of the trial
        - model : the estimator's name
        - method : jackknife+ of jackknife+-after-bootsrap
        - coverage : PIs' coverage
        - width : mean PI's width
        - m : the resampling set size
        - agg_function: aggregation method
    """

    results = pd.DataFrame(
        columns=["itrial", "estimator", "method", "coverage", "width", "m"],
        index=np.arange(trials * (2 * boostrap_size + 1)),
    )

    (X, y) = get_X_y()
    m_vals = np.round(
        train_size * np.linspace(0.1, 1, num=boostrap_size)
    ).astype(int)

    result_index = 0
    for itrial in range(trials):
        X_train, X_test, y_train, y_test = train_test_split(
            X, y, train_size=train_size, random_state=random_state + itrial
        )
        PIs = PIs = compute_PIs(
            estimator=model,
            X_train=X_train,
            y_train=y_train,
            X_test=X_test,
            method="plus",
            cv=-1,
            alpha=alpha,
            agg_function=agg_function,
        )
        (coverage, width) = get_coverage_width(PIs, y_test)
        results.iloc[result_index, :] = [
            itrial,
            type(model).__name__,
            "J+",
            coverage,
            width,
            0,
        ]
        result_index += 1

        for i_m, m in enumerate(m_vals):
            # J+aB, random B
            B_random = B_random_from_B_fixed(
                B_fixed, train_size, m, itrial=i_m
            )
            subsample_B_random = Subsample(
                n_resamplings=B_random,
                n_samples=m,
                replace=True,
                random_state=random_state,
            )
            PIs = compute_PIs(
                estimator=model,
                X_train=X_train,
                y_train=y_train,
                X_test=X_test,
                method="plus",
                cv=subsample_B_random,
                alpha=alpha,
                agg_function=agg_function,
            )
            (coverage, width) = get_coverage_width(PIs, y_test)
            results.iloc[result_index, :] = [
                itrial,
                type(model).__name__,
                "J+aB Random B",
                coverage,
                width,
                m,
            ]
            result_index += 1

            # J+aB, fixed B
            subsample_B_fixed = Subsample(
                n_resamplings=B_fixed,
                n_samples=m,
                replace=True,
                random_state=random_state,
            )
            PIs = PIs = compute_PIs(
                estimator=model,
                X_train=X_train,
                y_train=y_train,
                X_test=X_test,
                method="plus",
                cv=subsample_B_fixed,
                alpha=alpha,
                agg_function=agg_function,
            )
            (coverage, width) = get_coverage_width(PIs, y_test)
            results.iloc[result_index, :] = [
                itrial,
                type(model).__name__,
                "J+aB Fixed B",
                coverage,
                width,
                m,
            ]
            result_index += 1
    results["agg_function"] = agg_function
    results["alpha"] = alpha
    results = results.astype(
        {
            "itrial": int,
            "estimator": str,
            "method": str,
            "coverage": float,
            "width": float,
            "m": int,
            "agg_function": str,
        }
    )
    return results


def plot_results(results: pd.DataFrame, score: str) -> None:
    """
    Compares the desired score (i.e. coverage or width) between the Jackknife+
    and Jackknife+-after-Bootstrap and between fixed and random B parameter
    as in [1] simulations.

    Parameters
    ----------
    results : pd.DataFrame
        DataFrame returned by comparison_JAB.
    score: str
        'coverage' or 'width'
    """

    res = results.copy()
    res["fixed_random"] = res["method"].str.split("[' ']").str.get(1)
    res["method"] = res["method"].str.split().str.get(0)
    m_vals = res["m"].values
    res["ratio"] = m_vals / m_vals.max()
    data_J = res.loc[res.method == "J+", ["ratio", score]]
    data_JaB = res.loc[res.method == "J+aB", ["ratio", score]]
    data_fix = res.loc[res.fixed_random == "Fixed", ["ratio", score]]
    data_random = res.loc[res.fixed_random == "Random", ["ratio", score]]

    alpha = pd.unique(results["alpha"])[0]

    # plot the comparison between J+ vs J+AB
    fig, axes = plt.subplots(1, 2, figsize=(8, 6), sharey=True)
    data_J.boxplot(by="ratio", ax=axes[0])
    data_JaB.boxplot(by="ratio", ax=axes[1])

    if score == "coverage":
        axes[0].axhline(y=1 - alpha, color="red")
        axes[1].axhline(y=1 - alpha, color="red")
        xticks = mtick.PercentFormatter(1, decimals=0)
        axes[0].yaxis.set_major_formatter(xticks)
    axes[0].set_title("J+")
    axes[1].set_title("J+aB")
    axes[0].set_xticks([])
    axes[0].set_xlabel("")
    axes[1].set_xlabel("m/n", fontsize=14)
    axes[0].set_ylabel(score)
    fig.suptitle(
        f"\n Agg. function = {res['agg_function'].unique()[0]}"
        + f"\nModel = {res.estimator.unique()[0]}"
        + "\n Data=BLOG"
    )
    plt.show()

    # plot the comparison between random vs fixed B
    fig, axes = plt.subplots(1, 2, figsize=(8, 6), sharey=True)
    data_fix.boxplot(by="ratio", ax=axes[0])
    data_random.boxplot(by="ratio", ax=axes[1])
    axes[0].set_title("Fixed B", fontsize=14)
    axes[1].set_title("Random B", fontsize=14)
    if score == "coverage":
        axes[0].axhline(y=1 - alpha, color="red")
        axes[1].axhline(y=1 - alpha, color="red")
        axes[0].yaxis.set_major_formatter(xticks)
    axes[0].set_ylabel(score)
    axes[1].set_ylabel("")
    for ax in axes:
        ax.set_xlabel("m/n", fontsize=14)
    fig.suptitle(
        f"\n Agg. function = {res['agg_function'].unique()[0]}"
        + f"\nModel = {res.estimator.unique()[0]}"
        + "\n Data=BLOG"
    )
    plt.show()


if __name__ == "__main__":

    results_coverages_widths = comparison_JAB(
        model=Ridge2(),
        alpha=0.1,
        trials=2,
        train_size=40,
        boostrap_size=5,
        B_fixed=20,
    )
    print(results_coverages_widths.info())
    plot_results(results_coverages_widths, "coverage")
    plot_results(results_coverages_widths, "width")
Total running time of the script: ( 1 minutes 31.635 seconds)