mapie.metrics.regression.regression_mean_width_score
- mapie.metrics.regression.regression_mean_width_score(y_intervals: ndarray[tuple[Any, ...], dtype[_ScalarT]]) ndarray[tuple[Any, ...], dtype[_ScalarT]][source]
Effective mean width score obtained by the prediction intervals.
- Parameters:
- y_intervals: NDArray of shape (n_samples, 2, n_confidence_level)
Lower and upper bound of prediction intervals with different confidence levels, given by the predict_interval method
- Returns:
- NDArray of shape (n_confidence_level,)
Effective mean width of the prediction intervals for each confidence level.
Examples
>>> import numpy as np
>>> from mapie.metrics.regression import regression_mean_width_score
>>> y_intervals = np.array([[[4, 6, 8], [6, 9, 11]],
...                    [[9, 10, 11], [10, 12, 14]],
...                    [[8.5, 9.5, 10], [12.5, 12, 13]],
...                    [[7, 8, 9], [8.5, 9.5, 10]],
...                    [[5, 6, 7], [6.5, 8, 9]]])
>>> print(regression_mean_width_score(y_intervals))
[2.  2.2 2.4]
Examples using mapie.metrics.regression.regression_mean_width_score
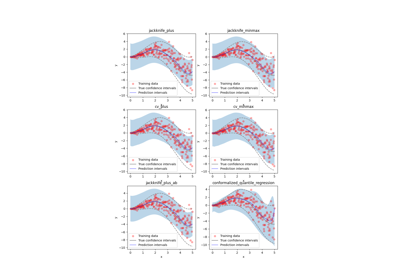
Conformalized quantile regression on gamma distributed data
Conformalized quantile regression on gamma distributed data
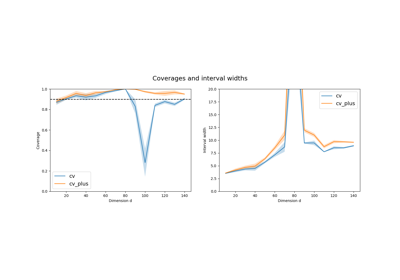
Predictive inference with the jackknife+, Foygel-Barber et al. (2020)
Predictive inference with the jackknife+, Foygel-Barber et al. (2020)
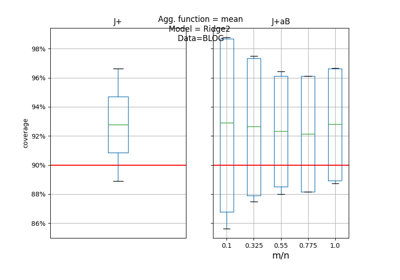
Predictive inference is free with the Jackknife+-after-Bootstrap, Kim et al. (2020)
Predictive inference is free with the Jackknife+-after-Bootstrap, Kim et al. (2020)