Note
Click here to download the full example code
Conformal Prediction Intervals for Gaussian Process Surrogates, Jaber et al. (2025)
This example reproduces the core experiment from:
Jaber, E., Blot, V. et al., *Conformal approach to Gaussian process surrogate
evaluation with marginal coverage guarantees*, Journal of Machine Learning for
Modeling and Computing, 6(3), 2025.
https://doi.org/10.1615/JMachLearnModelComput.2025054687
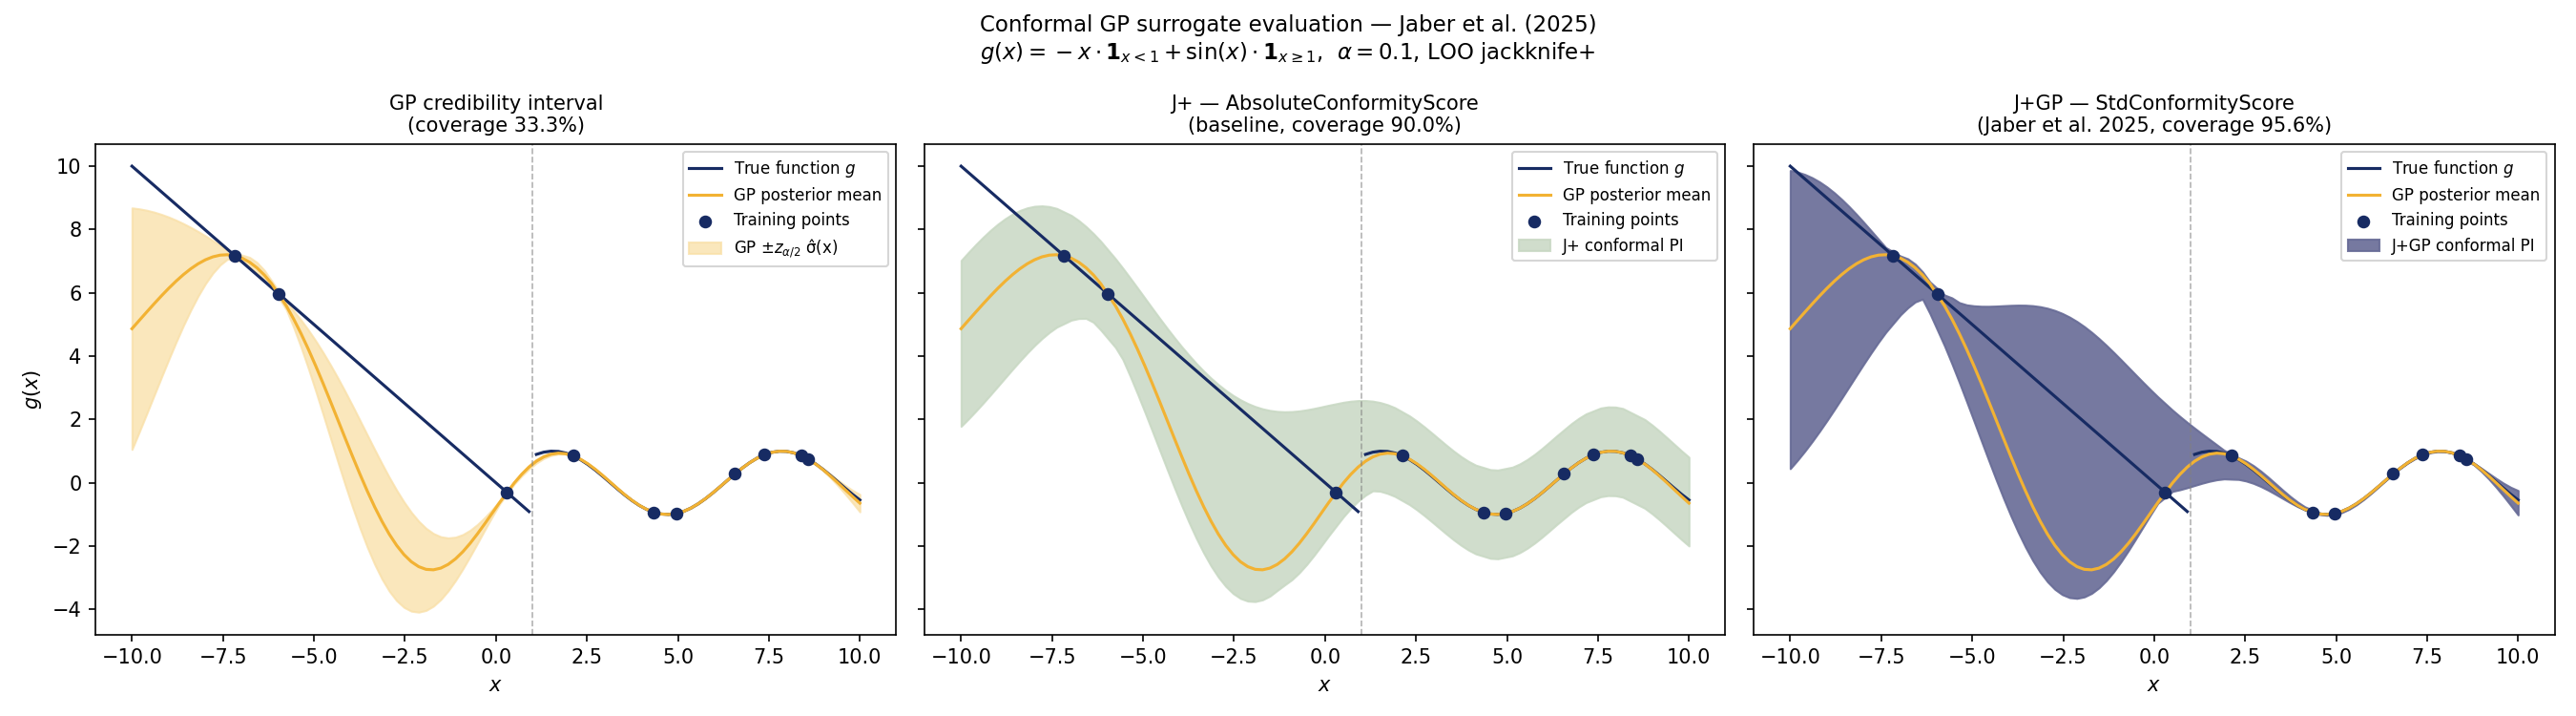
We compare three uncertainty quantification strategies on a 1-D discontinuous
test function g:
-
GP posterior credibility interval — the raw ±z_{α/2} σ̂(x) band from the fitted Gaussian process. Provides marginal coverage only under the GP model assumptions, which can fail near discontinuities.
-
Jackknife+ with GP std (J+GP / StdConformityScore) — conformity scores are normalised by the GP posterior standard deviation σ̂(x), so the residuals are σ-scaled. This is the method analysed in Jaber et al. (2025) and yields marginal coverage guarantees regardless of the GP model assumptions.
-
Jackknife+ without GP std (J+ / AbsoluteConformityScore) — plain absolute residuals, ignoring heteroscedasticity. Serves as a baseline.
Out:
  N training points = 10
  N testing  points = 90

Empirical coverage at 1-α=90%:
  GP credibility interval  : 33.3%
  J+GP (StdConformityScore): 95.6%
  J+   (AbsoluteScore)     : 90.0%
# sphinx_gallery_thumbnail_number = 1

import warnings

import matplotlib.pyplot as plt
import numpy as np
import scipy.stats
from sklearn.gaussian_process import GaussianProcessRegressor
from sklearn.gaussian_process.kernels import RBF, ConstantKernel
from sklearn.model_selection import train_test_split

from mapie.conformity_scores import AbsoluteConformityScore, StdConformityScore
from mapie.regression import CrossConformalRegressor

warnings.simplefilter("ignore")

# ---------------------------------------------------------------------------
# Plotting style
# ---------------------------------------------------------------------------

NAVY = "#172B63"
POSTERIOR_MEAN = "#F2B233"
GP_BAND = "#F9DFA6"
JPLUS_BAND = "#C8D8C3"
JPLUS_GP_BAND = "#676B96"

plt.rcParams["figure.dpi"] = 150

# ---------------------------------------------------------------------------
# Test function — piecewise discontinuous (same as Jaber et al. 2025)
# ---------------------------------------------------------------------------

DISCONTINUITY = 1.0
ALPHA = 0.1


def g(x: np.ndarray, discontinuity: float = DISCONTINUITY) -> np.ndarray:
    """
    Piecewise function:
        g(x) = -x   if x < discontinuity
        g(x) = sin(x)  if x >= discontinuity

    The discontinuity at x=1 makes the GP model misspecified there,
    stressing the coverage guarantees.
    """
    x_return = np.array(x, dtype=float)
    neg = x_return < discontinuity
    pos = ~neg
    x_return[neg] = -x_return[neg]
    x_return[pos] = np.sin(x_return[pos])
    return x_return


# ---------------------------------------------------------------------------
# Data
# ---------------------------------------------------------------------------

x_mesh = np.linspace(-10, 10, 100)
X_train, X_test, y_train, y_test = train_test_split(
    x_mesh, g(x_mesh), test_size=0.9, random_state=42
)

X_train = X_train.reshape(-1, 1)
X_test = X_test.reshape(-1, 1)

# Sort test set for clean line plots
x_test_order = np.argsort(X_test[:, 0])
X_test = X_test[x_test_order]
y_test = y_test[x_test_order]

print(f"  N training points = {len(X_train)}")
print(f"  N testing  points = {len(X_test)}")

# ---------------------------------------------------------------------------
# Gaussian Process (sklearn) — RBF kernel with constant amplitude
# ---------------------------------------------------------------------------

kernel = ConstantKernel(1.0) * RBF(length_scale=1.0)
gp = GaussianProcessRegressor(
    kernel=kernel,
    alpha=1e-6,  # numerical stability nugget
    normalize_y=True,
    n_restarts_optimizer=5,
    random_state=42,
)
gp.fit(X_train, y_train)

# ---------------------------------------------------------------------------
# MAPIE CrossConformalRegressor — Jackknife+ variants
# ---------------------------------------------------------------------------

# J+GP: conformity scores normalised by GP posterior std (Jaber et al. 2025)
mapie_jplus_gp = CrossConformalRegressor(
    estimator=gp,
    cv=-1,  # leave-one-out (jackknife+)
    method="plus",
    confidence_level=1 - ALPHA,
    conformity_score=StdConformityScore(),
    verbose=0,
    random_state=42,
)

# J+: plain absolute conformity scores (no GP std normalisation)
mapie_jplus = CrossConformalRegressor(
    estimator=gp,
    cv=-1,
    method="plus",
    confidence_level=1 - ALPHA,
    conformity_score=AbsoluteConformityScore(),
    verbose=0,
    random_state=42,
)

mapie_jplus_gp.fit_conformalize(X_train, y_train)
mapie_jplus.fit_conformalize(X_train, y_train)

# ---------------------------------------------------------------------------
# Predictions
# ---------------------------------------------------------------------------

_, y_pis_jplus_gp = mapie_jplus_gp.predict_interval(X_test)
_, y_pis_jplus = mapie_jplus.predict_interval(X_test)

y_mean, y_std = gp.predict(X_test, return_std=True)

# Raw GP credibility interval quantiles
q_lo = scipy.stats.norm.ppf(ALPHA / 2)
q_hi = scipy.stats.norm.ppf(1 - ALPHA / 2)

# ---------------------------------------------------------------------------
# Empirical coverage
# ---------------------------------------------------------------------------


def coverage(y_true, y_pis):
    return float(np.mean((y_true >= y_pis[:, 0, 0]) & (y_true <= y_pis[:, 1, 0])))


cov_gp = float(
    np.mean((y_test >= y_mean + y_std * q_lo) & (y_test <= y_mean + y_std * q_hi))
)
cov_jplus_gp = coverage(y_test, y_pis_jplus_gp)
cov_jplus = coverage(y_test, y_pis_jplus)

print(f"\nEmpirical coverage at 1-α={1 - ALPHA:.0%}:")
print(f"  GP credibility interval  : {cov_gp:.1%}")
print(f"  J+GP (StdConformityScore): {cov_jplus_gp:.1%}")
print(f"  J+   (AbsoluteScore)     : {cov_jplus:.1%}")

# ---------------------------------------------------------------------------
# Plot
# ---------------------------------------------------------------------------

fig, axes = plt.subplots(1, 3, figsize=(18, 5), sharey=True)
titles = [
    f"GP credibility interval\n(coverage {cov_gp:.1%})",
    f"J+ — AbsoluteConformityScore\n(baseline, coverage {cov_jplus:.1%})",
    f"J+GP — StdConformityScore\n(Jaber et al. 2025, coverage {cov_jplus_gp:.1%})",
]

for ax, title in zip(axes, titles):
    # True function
    ax.plot(
        x_mesh[x_mesh < DISCONTINUITY],
        g(x_mesh)[x_mesh < DISCONTINUITY],
        color=NAVY,
        lw=1.5,
        label="True function $g$",
    )
    ax.plot(
        x_mesh[x_mesh >= DISCONTINUITY],
        g(x_mesh)[x_mesh >= DISCONTINUITY],
        color=NAVY,
        lw=1.5,
    )
    # GP mean
    ax.plot(
        X_test[:, 0], y_mean, color=POSTERIOR_MEAN, lw=1.5, label="GP posterior mean"
    )
    # Training data
    ax.scatter(
        X_train[:, 0], y_train, color=NAVY, s=30, zorder=5, label="Training points"
    )
    ax.set_xlabel("$x$")
    ax.set_title(title, fontsize=10)

# Panel 0: GP credibility band
axes[0].fill_between(
    X_test[:, 0],
    y_mean + y_std * q_lo,
    y_mean + y_std * q_hi,
    alpha=0.75,
    color=GP_BAND,
    label="GP ±$z_{{α/2}}$ σ̂(x)",
)

# Panel 1: J+ conformal interval
axes[1].fill_between(
    X_test[:, 0],
    y_pis_jplus[:, 0, 0],
    y_pis_jplus[:, 1, 0],
    alpha=0.85,
    color=JPLUS_BAND,
    label="J+ conformal PI",
)

# Panel 2: J+GP conformal interval
axes[2].fill_between(
    X_test[:, 0],
    y_pis_jplus_gp[:, 0, 0],
    y_pis_jplus_gp[:, 1, 0],
    alpha=0.9,
    color=JPLUS_GP_BAND,
    label="J+GP conformal PI",
)

for ax in axes:
    ax.legend(fontsize=8, loc="upper right")
    ax.axvline(DISCONTINUITY, color="grey", lw=0.8, ls="--", alpha=0.6)

axes[0].set_ylabel("$g(x)$")
plt.suptitle(
    "Conformal GP surrogate evaluation — Jaber et al. (2025)\n"
    r"$g(x) = -x \cdot \mathbf{1}_{x<1} + \sin(x) \cdot \mathbf{1}_{x \geq 1}$,"
    f"  $\\alpha={ALPHA}$, LOO jackknife+",
    fontsize=11,
)
plt.tight_layout()
plt.savefig("plot_Jaber2024.png", dpi=150, bbox_inches="tight")
plt.show()
Total running time of the script: ( 0 minutes 2.323 seconds)
Download Python source code: plot_jaber2024.py