mapie.metrics.regression.regression_coverage_score
- mapie.metrics.regression.regression_coverage_score(y_true: ndarray[tuple[Any, ...], dtype[_ScalarT]], y_intervals: ndarray[tuple[Any, ...], dtype[_ScalarT]]) ndarray[tuple[Any, ...], dtype[_ScalarT]][source]
Effective coverage obtained by the prediction intervals.
Intervals given by the predict_interval method can be passed directly to the y_intervals argument (see example below).
Beside this intended use, this function also works with:
y_true of shape (n_sample,) and y_intervals of shape (n_sample, 2)
y_true of shape (n_sample, n) and y_intervals of shape (n_sample, 2, n)
The effective coverage is obtained by computing the fraction of true labels that lie within the prediction intervals.
- Parameters:
- y_true: NDArray of shape (n_samples,)
True labels.
- y_intervals: NDArray of shape (n_samples, 2, n_confidence_level)
Lower and upper bound of prediction intervals with different confidence levels, given by the predict_interval method
- Returns:
- NDArray of shape (n_confidence_level,)
Effective coverage obtained by the prediction intervals for each confidence level.
Examples
>>> from mapie.metrics.regression import regression_coverage_score
>>> from mapie.regression import SplitConformalRegressor
>>> from mapie.utils import train_conformalize_test_split
>>> from sklearn.datasets import make_regression
>>> from sklearn.model_selection import train_test_split
>>> from sklearn.linear_model import Ridge
>>> X, y = make_regression(n_samples=500, n_features=2, noise=1.0)
>>> (
...     X_train, X_conformalize, X_test,
...     y_train, y_conformalize, y_test
... ) = train_conformalize_test_split(
...     X, y, train_size=0.6, conformalize_size=0.2, test_size=0.2, random_state=1
... )
>>> mapie_regressor = SplitConformalRegressor(
...     estimator=Ridge(),
...     confidence_level=0.95,
...     prefit=False,
... ).fit(X_train, y_train).conformalize(X_conformalize, y_conformalize)
>>> predicted_points, predicted_intervals = mapie_regressor.predict_interval(X_test)
>>> coverage = regression_coverage_score(y_test, predicted_intervals)[0]
Examples using mapie.metrics.regression.regression_coverage_score

The symmetric correction parameter in conformalized quantile regression
Hyperparameters tuning with cross-conformal regression
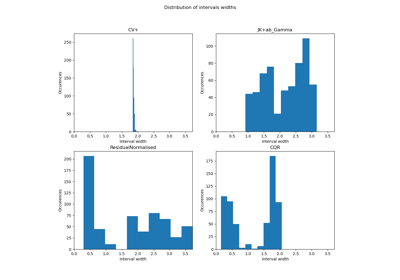
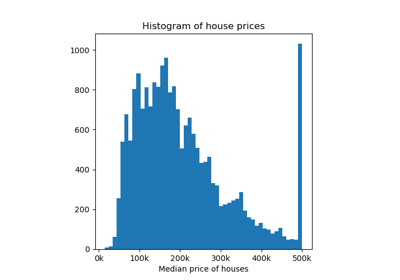
Conformalized quantile regression on gamma distributed data

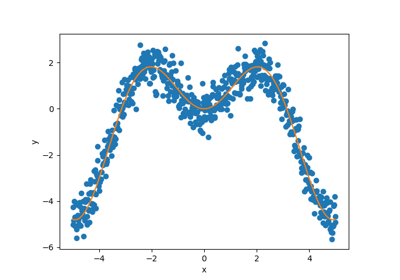
sphx_glr_examples_regression_2-advanced-analysis_plot_main-tutorial-regression.py
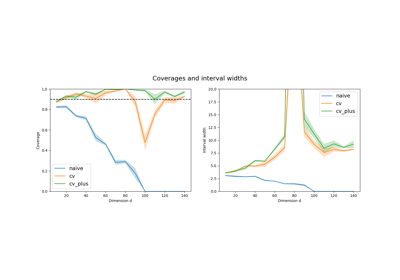
Predictive inference with the jackknife+, Foygel-Barber et al. (2020)
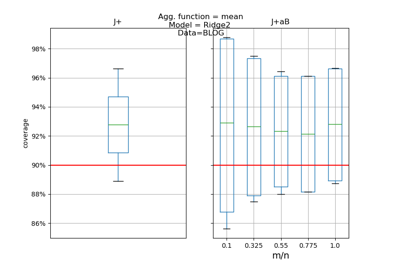
Predictive inference is free with the Jackknife+-after-Bootstrap, Kim et al. (2020)

sphx_glr_examples_mondrian_1-quickstart_plot_main-tutorial-mondrian-regression.py