mapie.metrics.hsic
- mapie.metrics.hsic(y_true: numpy.ndarray[Any, numpy.dtype[numpy._typing._array_like._ScalarType_co]], y_intervals: numpy.ndarray[Any, numpy.dtype[numpy._typing._array_like._ScalarType_co]], kernel_sizes: Union[numpy._typing._array_like._SupportsArray[numpy.dtype[Any]], numpy._typing._nested_sequence._NestedSequence[numpy._typing._array_like._SupportsArray[numpy.dtype[Any]]], bool, int, float, complex, str, bytes, numpy._typing._nested_sequence._NestedSequence[Union[bool, int, float, complex, str, bytes]]] = (1, 1)) numpy.ndarray[Any, numpy.dtype[numpy._typing._array_like._ScalarType_co]][source]
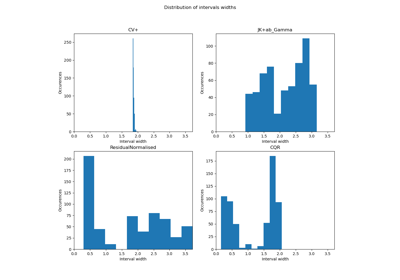
Compute the square root of the hsic coefficient. HSIC is Hilbert-Schmidt independence criterion that is a correlation measure. Here we use it as proposed in [4], to compute the correlation between the indicator of coverage and the interval size.
If hsic is 0, the two variables (the indicator of coverage and the interval size) are independant.
Warning: This metric should be used only with non constant intervals (intervals of different sizes), with constant intervals the result may be misinterpreted.
[4] Feldman, S., Bates, S., & Romano, Y. (2021). Improving conditional coverage via orthogonal quantile regression. Advances in Neural Information Processing Systems, 34, 2060-2071.
- Parameters
- y_true: NDArray of shape (n_samples,)
True labels.
- y_intervals: NDArray of shape (n_samples, 2, n_alpha) or (n_samples, 2)
Prediction sets given by booleans of labels.
- kernel_sizes: ArrayLike of size (2,)
The variance (sigma) for each variable (the indicator of coverage and the interval size), this coefficient controls the width of the curve.
- Returns
- NDArray of shape (n_alpha,)
One hsic correlation coefficient by alpha.
- Raises
- ValueError
If kernel_sizes has a length different from 2 and if it has negative or null values.
Examples
>>> from mapie.metrics import hsic
>>> import numpy as np
>>> y_true = np.array([9.5, 10.5, 12.5])
>>> y_intervals = np.array([
... [[9, 9], [10.0, 10.0]],
... [[8.5, 9], [12.5, 12]],
... [[10.5, 10.5], [12.0, 12]]
... ])
>>> print(hsic(y_true, y_intervals))
[0.31787614 0.2962914 ]
