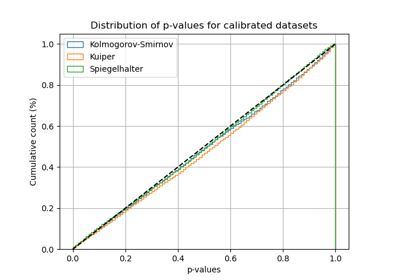
mapie.metrics.kuiper_p_value
- mapie.metrics.kuiper_p_value(y_true: numpy.ndarray[Any, numpy.dtype[numpy._typing._array_like._ScalarType_co]], y_score: numpy.ndarray[Any, numpy.dtype[numpy._typing._array_like._ScalarType_co]]) float[source]
Compute Kuiper statistic p-value. Deduced from the corresponding statistic and CDF. It represents the probability of the observed statistic under the null hypothesis of perfect calibration.
- Parameters
- y_trueNDArray of shape (n_samples,)
An array of ground truth.
- y_scoreNDArray of shape (n_samples,)
An array of scores.
- Returns
- float
The Kuiper p-value.
References
Tygert M. Calibration of P-values for calibration and for deviation of a subpopulation from the full population. arXiv preprint arXiv:2202.00100. 2022 Jan 31.
William Feller. The Asymptotic Distribution of the Range of Sums of Independent Random Variables. Ann. Math. Statist. 22 (3) 427 - 432 September, 1951.
