mapie.metrics.regression_coverage_score
- mapie.metrics.regression_coverage_score(y_true: Union[numpy._typing._array_like._SupportsArray[numpy.dtype[Any]], numpy._typing._nested_sequence._NestedSequence[numpy._typing._array_like._SupportsArray[numpy.dtype[Any]]], bool, int, float, complex, str, bytes, numpy._typing._nested_sequence._NestedSequence[Union[bool, int, float, complex, str, bytes]]], y_pred_low: Union[numpy._typing._array_like._SupportsArray[numpy.dtype[Any]], numpy._typing._nested_sequence._NestedSequence[numpy._typing._array_like._SupportsArray[numpy.dtype[Any]]], bool, int, float, complex, str, bytes, numpy._typing._nested_sequence._NestedSequence[Union[bool, int, float, complex, str, bytes]]], y_pred_up: Union[numpy._typing._array_like._SupportsArray[numpy.dtype[Any]], numpy._typing._nested_sequence._NestedSequence[numpy._typing._array_like._SupportsArray[numpy.dtype[Any]]], bool, int, float, complex, str, bytes, numpy._typing._nested_sequence._NestedSequence[Union[bool, int, float, complex, str, bytes]]]) float[source]
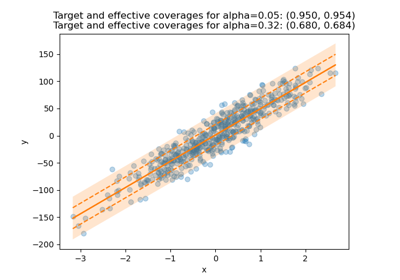
Effective coverage score obtained by the prediction intervals.
The effective coverage is obtained by estimating the fraction of true labels that lie within the prediction intervals.
- Parameters
- y_true: ArrayLike of shape (n_samples,)
True labels.
- y_pred_low: ArrayLike of shape (n_samples,)
Lower bound of prediction intervals.
- y_pred_up: ArrayLike of shape (n_samples,)
Upper bound of prediction intervals.
- Returns
- float
Effective coverage obtained by the prediction intervals.
Examples
>>> from mapie.metrics import regression_coverage_score
>>> import numpy as np
>>> y_true = np.array([5, 7.5, 9.5, 10.5, 12.5])
>>> y_pred_low = np.array([4, 6, 9, 8.5, 10.5])
>>> y_pred_up = np.array([6, 9, 10, 12.5, 12])
>>> print(regression_coverage_score(y_true, y_pred_low, y_pred_up))
0.8